
Key takeaways
AI adoption is accelerating across the legal profession, with growing use of both general-purpose and legal-specific AI tools.
Law firms continue to face operational and financial pressures related to billing, collections, staffing, and burnout.
Legal professionals have concerns about access to justice, affordability, and threats to the rule of law.
Firms are increasingly investing in technology to improve efficiency, strengthen financial oversight, and support long-term growth.
The legal industry continues to evolve each year. With AI, and specifically generative AI, settling into the legal tech space, law firms adopting more technology, and client expectations shifting, it can be tough to keep up with the latest changes.
Understanding the state of the industry can help your law firm stay ahead of the curve. Below, we’ll go over 84 lawyer statistics in areas including labor, legal demographics, technology, finance, and attorney mental health. Drawing from the 8amTM 2026 Legal Industry Report, the U.S. Bureau of Labor Statistics, and other authoritative sources, these statistics provide a snapshot of the legal profession and shed light on upcoming trends.
Lawyer labor statistics
The future looks bright for lawyers as the profession is expected to grow over the next decade. If you’re planning to start a law firm, it’s natural to have a few questions. How many lawyers are there in the U.S.? What’s the average lawyer’s salary? Below, you’ll learn about the current state of the industry’s labor and wages. Statistics reflect the most recent available data from each source.
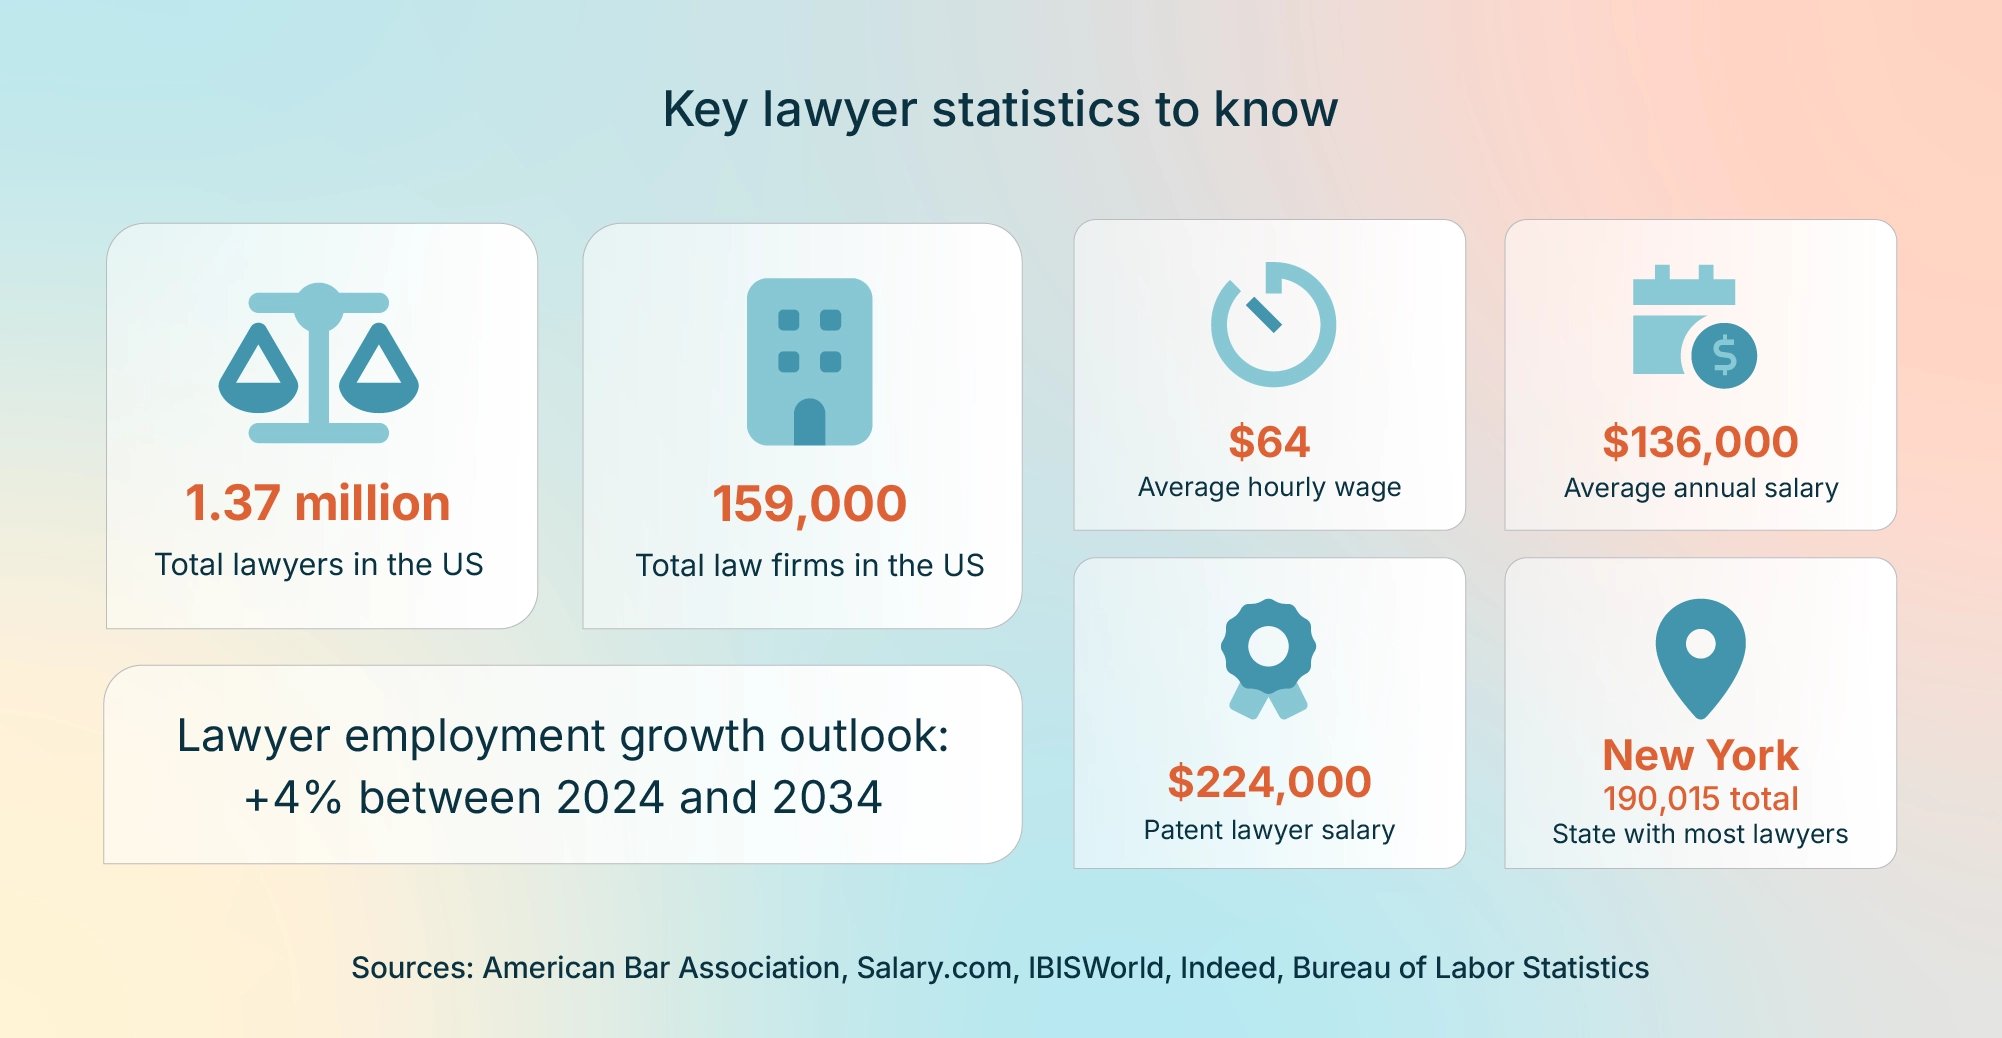
There were an estimated 1.37 million lawyers employed in the U.S. in 2025. (American Bar Association)
The average annual pay for lawyers in the U.S. is about $136,600 as of May 2026. Salaries have declined since 2025, when the average was about $145,000. (Salary.com)
The average hourly wage for lawyers is $64 as of May 2026. (Salary.com)
States with the highest number of active lawyers in 2025 were New York (190,015); California (181,048); Texas (99,867); Florida (80,976); and District of Columbia (65,824). (American Bar Association)
Lawyer employment is projected to grow 4% between 2024 and 2034. (U.S. Bureau of Labor Statistics)
There are projected to be 31,500 job openings for lawyers on average each year between 2024 and 2034. (U.S. Bureau of Labor Statistics)
There were about 159,000 law firms in the U.S. in 2025. (IBISWorld)
Patent lawyers are among the highest-paid attorneys, with a national average annual salary of about $224,000 (as of May 2026). (Indeed)
The top-paying states for lawyers in 2025 were the District of Columbia ($242,800 average annual salary), California ($230,040), New York ($220,180), Colorado ($206,440), and Massachusetts ($205,980). (U.S. Bureau of Labor Statistics)
Lawyer demographics statistics
Although white men over the age of 45 have represented the majority of lawyers over the years, the workforce is becoming increasingly diverse as more women and people of color are pursuing this career. Learn more about the current demographic breakdown of lawyers below.
40.5% of lawyers were women in 2025, compared to 40.9% in 2024 and 39.5% in 2023. (National Association for Law Placement)
33% of sitting Article III federal judges and 43% of state supreme court justices were women in 2024. (ABA Profile of the Legal Profession 2024)
The median age of lawyers was 46 in 2025. (U.S. Bureau of Labor Statistics)
35 to 44-year-olds made up about 25% of lawyers in 2025. (U.S. Bureau of Labor Statistics)
About 30% of lawyers were age 55 and over in 2025. (U.S. Bureau of Labor Statistics)
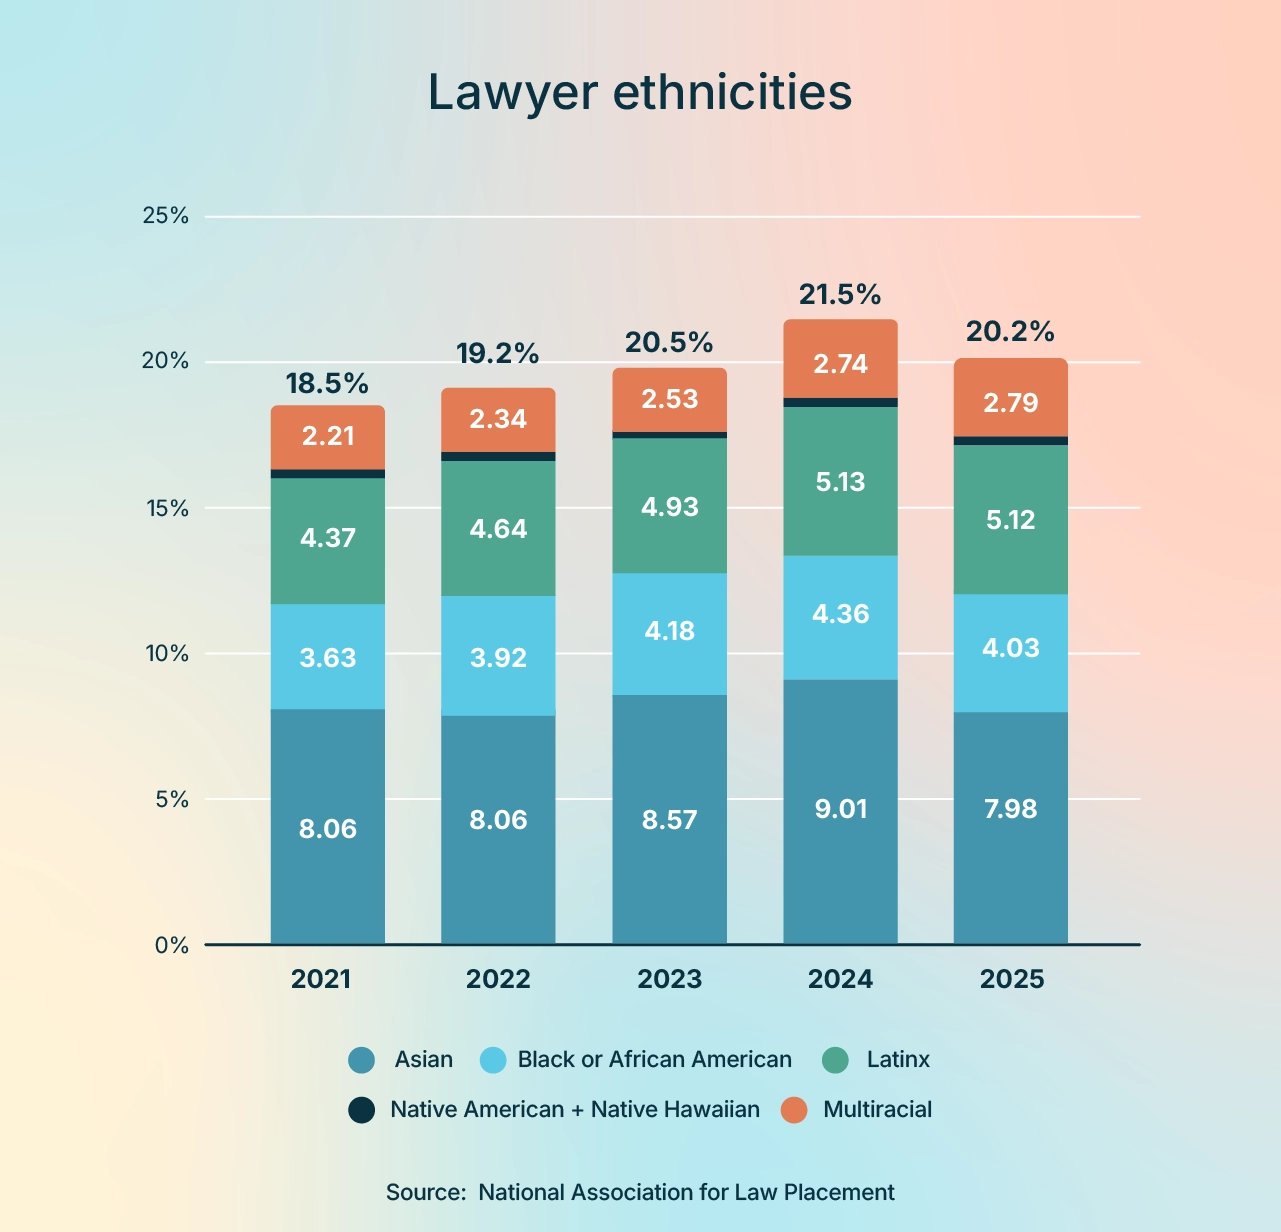
Lawyers of color represented 20% of the legal profession in 2025, up from 14.6% a decade earlier. (National Association for Law Placement)
8% of lawyers were Asian in 2025, compared to about 6% in 2015. (National Association for Law Placement)
5% of lawyers were Latinx in 2025, up from 3% in 2015. (National Association for Law Placement)
4% of lawyers in 2025 were Black or African American, up from 2.8% in 2015. (National Association for Law Placement)
In 2025, 2.8% of lawyers were multiracial, doubling from 1.4% in 2015. (National Association for Law Placement)
Just 0.26% of lawyers were Native American, Alaska Native, Native Hawaiian, or other Pacific Islander in 2025, a slight increase from 0.21% in 2015. (National Association for Law Placement)
About 13% of law firm partners and 30% of associates were people of color in 2025. (National Association for Law Placement)
Technology and legal AI statistics
Gone are the days of file cabinets, paper checks, and illegible time-tracking scribbles on your legal pad. Legal AI and other modern technology can take tedious tasks and turn them into streamlined functions that help your firm save time and money.
Choosing the right legal technology providers is important to ensure easy adoption, usability, and compliance. Below are some statistics highlighting current trends in legal technology and AI adoption.
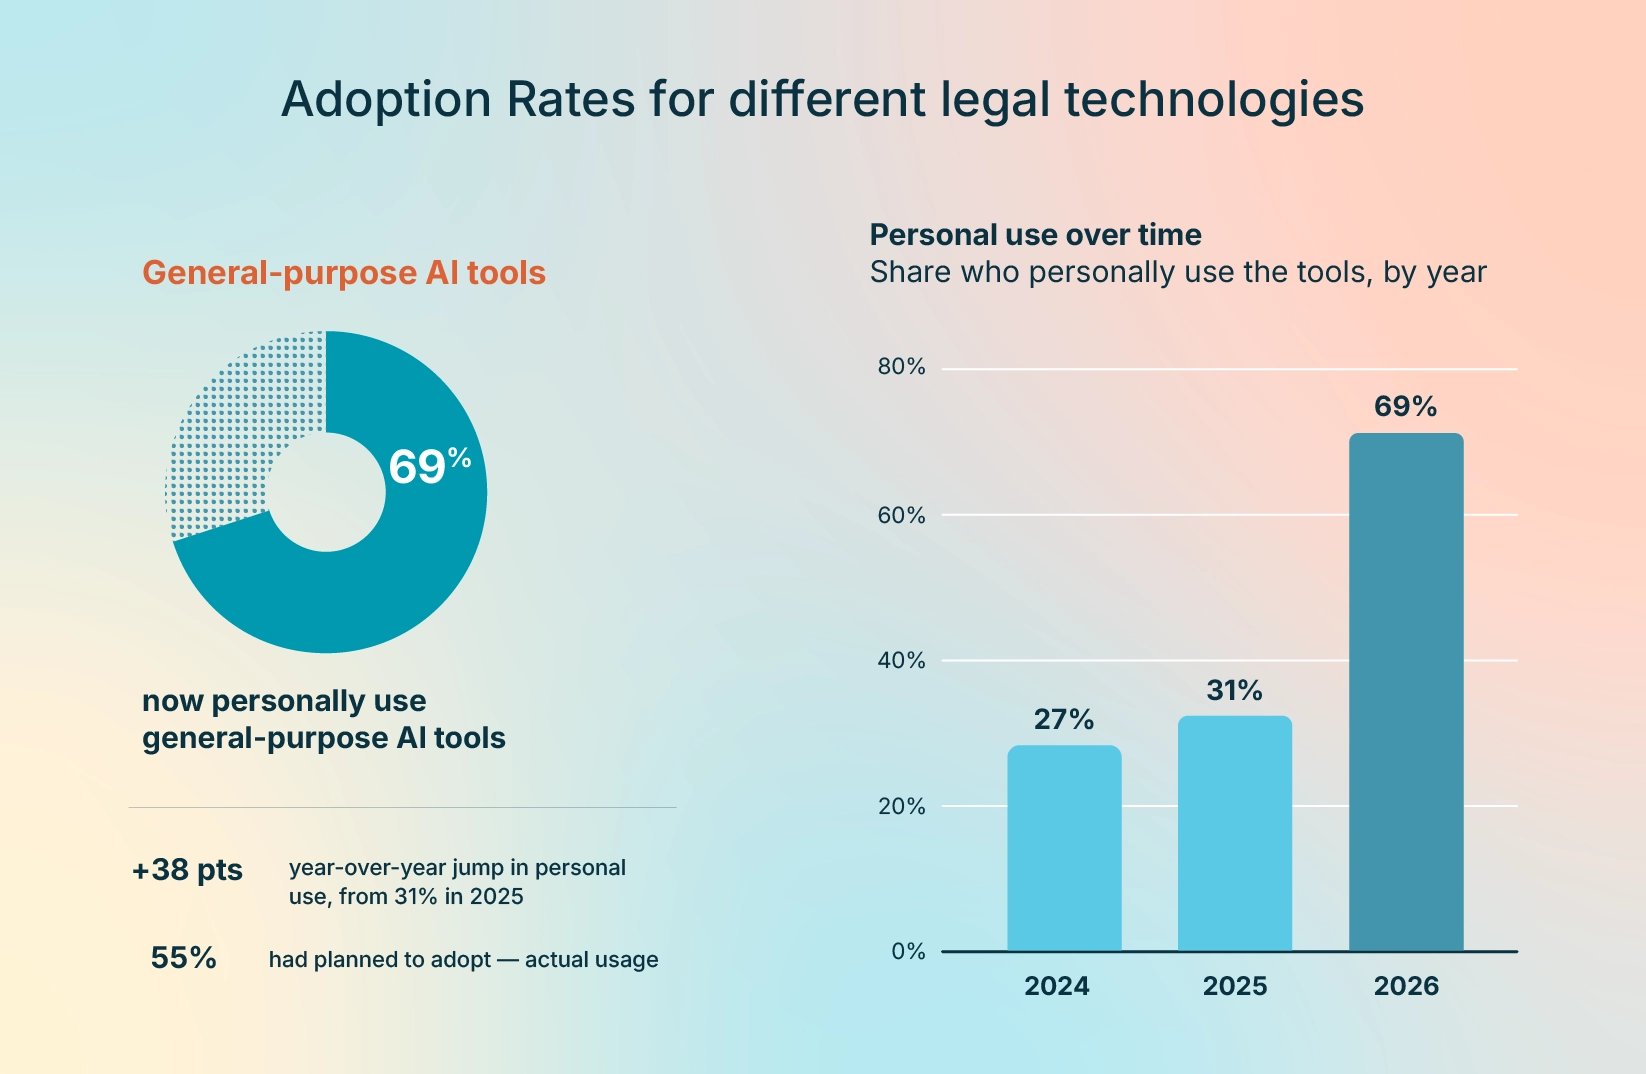
69% of legal professionals use general-purpose AI tools like ChatGPT and Claude for work-related tasks (up from 31% in 2025). 42% personally use legal-specific AI tools. (2026 Legal Industry Report)
82% of immigration lawyers use general-purpose AI tools, the highest rate among all practice areas. 40% of immigration law practitioners use AI daily. (2026 Legal Industry Report)
The top uses for general-purpose AI tools among legal professionals in 2026 are: Drafting correspondence (58%), general research (58%), brainstorming (54%), and summarizing documents (47%). (2026 Legal Industry Report)
34% of law firms have adopted legal-specific AI tools in 2026 (up from 21% last year). (2026 Legal Industry Report)
Top uses for legal-specific AI include: legal research (58%); drafting documents (49%); and summarizing documents (47%). (2026 Legal Industry Report)
In 2026, 28% of legal professionals who have adopted generative AI tools use them every day, 31% use them several times per week, and 10% use them once a month or less. (2026 Legal Industry Report)
61% of those surveyed for the report said AI saves them time every week. 33% reported that AI does not save them time but does help improve the quality of their work. (2026 Legal Industry Report)
Data security is a key barrier slowing AI adoption at law firms, with 46% of legal professionals expressing significant concerns about this issue. Other barriers include ethical concerns (42%), privilege concerns (39%), and lack of trust in AI-generated results (39%). (2026 Legal Industry Report)
54% of law firms have provided no AI training and have no plans to do so, as of 2026. Only 9% have a written, enforced AI use policy. (2026 Legal Industry Report)
29% of legal professionals expect AI tools to deliver the biggest ROI of any legal tech investment over the next 3 years. Other technologies expected to drive ROI include case management software (25%), legal research tools (18%), and billing and timekeeping tools (15%). (2026 Legal Industry Report)
61% of survey respondents believe technical fluency with AI tools will become more valuable as AI adoption increases. Other skills expected to gain value include legal judgment and strategy (53%); client relationship management (52%); and data analysis (49%). (2026 Legal Industry Report)
44% of respondents expect that AI will lead the creation of new roles and specialties in the legal profession. (2026 Legal Industry Report)
39% of survey respondents expect AI will lead to reductions in paralegal and support roles at law firms. 21% expect fewer junior associate positions. (2026 Legal Industry Report)
In 2025, 19% of personal injury firms expected AI to replace outsourced work—significantly higher than the 12% average across all practice areas. (Legal Industry Report: Personal Injury Insights).
The top three reasons that prevented legal professionals from learning about and researching new software tools for their firm in 2023 were that the research process is too time-consuming (44%), they have no need for new software (33%), and there’s not enough unbiased information available (28%) (2024 Legal Industry Trends Report)
58% of law firms used an online texting tool (without the use of a personal cellphone) in 2023. (2024 Legal Industry Trends Report)
44% of law firms who used online text messaging saved 1-2 hours each week, 17% saved 3-5 hours, and 9% saved 5 hours in 2023. (2024 Legal Industry Trends Report)
Only 16% of law firms used rules-based calendaring software in 2023. (2024 Legal Industry Trends Report)
37% of law firms who used rules-based calendaring software saved 1-2 hours each week, 15% saved 3-5 hours, and 10% saved 5+ hours in 2023. (2024 Legal Industry Trends Report)
Our customers captured 58,395 leads from MyCase’s customized lead intake forms in 2023. Of these leads, 10,286 became clients. (2024 Legal Industry Trends Report)
In 2023, 33% of law firms using a virtual receptionist gained 1-2 leads a week, 21% gained 3-5, and 19% gained 5+ leads. (2024 Legal Industry Trends Report)
23% of law firms using a virtual receptionist in 2023 saved 10+ hours each month, 20% saved 6-10 hours, and 43% saved 1-5 hours. (2024 Legal Industry Trends Report)
91% of law firms had the ability to eFile in 2023. (2024 Legal Industry Trends Report)
34% of law firms who used eFiling in 2023 saved 1-2 hours each week, 27% saved 3-5 hours, and 26% saved 5+ hours. (2024 Legal Industry Trends Report)
Law firm finances, billing, and payments statistics
Law firm financial management was probably not a driving force in your decision to become a lawyer. Reconciling accounts, keeping track of time and expenses, and following up on client payments are parts of the job that law school likely didn’t cover. However, these functions are necessary to improve your law firm’s profitability and stay financially afloat.
The following law statistics shed light on how law firms are managing their finances and what tools they use to streamline their processes.
Nearly 50% of legal professionals surveyed for the 2026 Legal Industry Report said they expect AI to impact their firms’ billing practices, either by reducing the number per case (25%) or driving adoption of flat fees or alternative billing arrangements (22%). (2026 Legal Industry Report)
15% of 2026 Legal Industry Report respondents reported their clients have asked about AI-driven efficiency improvements—but only 6% said clients have pushed for cost reductions related to AI usage. (2026 Legal Industry Report)
82% of law firms accepted online payments via credit and debit cards in 2025, up from 78% in the previous year. (2025 Legal Industry Report)
59% of legal professionals surveyed for the 2025 Legal Industry Report said accepting credit and debit cards helped increase their firms’ collection rates. (2025 Legal Industry Report)
28% of firms reported collecting significantly more fees through online payments in 2025. (2025 Legal Industry Report)
68% of respondents identified collecting legal fees as a significant or moderate challenge for their firm in 2025. Other key financial challenges included managing payroll (66%), accounting (61%), and collecting reimbursable expenses (57%). (2025 Legal Industry Report)
49% of personal injury firms cited accounting as a top financial challenge—lower than the overall average across all practice areas, but still a significant hurdle. (Legal Industry Report: Personal Injury Insights)
30% of law firms used legal accounting software in 2025. Of these firms, 28% reported that the software saved them 6 or more hours per month. (2025 Legal Industry Report)
67% of law firms used basic time-tracking software in 2025. 53% of these firms saved 1 or more hours each month by using time-tracking tools. (2025 Legal Industry Report)
56% of firms that used passive time-tracking tools that run in the background while work was performed reported measurable time savings in 2025. 25% saved 6 or more hours each month. (2025 Legal Industry Report)
43% of personal injury firms reported using trust accounting software in 2025, with many saving between 1-15 hours per month thanks to automation (Legal Industry Report: Personal Injury Insights).
48% of personal injury firms used invoicing software in 2025, with 22% reporting time savings of 1-5 hours per month and 19% saving 6–10 hours (Legal Industry Report: Personal Injury Insights).
56% of law firms set up payment plans for clients in 2023. (2024 Legal Industry Trends Report)
48% of law firms that offered payment plans in 2023 said they collected more money over the lifetime of a case compared to when they didn’t offer them. (2024 Legal Industry Trends Report)
Only 19% of law firms offered a “Pay Later” legal fee financing option in 2023, but 47% say they can accept more cases by offering this option. (2024 Legal Industry Trends Report)
The average term for a law firm payment plan is 258 days, according to 8am MyCase data from 2023. (2024 Legal Industry Trends Report)
Our customers who used our Smart Time Finder tool in 2023 captured an additional 579,665 hours, which amounts to an additional $22,425 in billable hours per lawyer (assuming a $330 hourly rate). (2024 Legal Industry Trends Report)
51% of law firms charged for consultations in 2023. Of those who charged, 89% accepted online payments via credit/debit card. (2024 Legal Industry Trends Report)
Our customers collected nearly $17 million from consultation fees paid online compared to about $2 million collected by cash and check in 2023. (2024 Legal Industry Trends Report)
The average time to receive the first payment after lead intake for all practice areas was 38 days in 2023. (2024 Benchmark Report: Part 2)
The average time to receive the first payment after lead intake for law firms in the traffic practice area was 8 days in 2023. (2024 Benchmark Report: Part 2)
The average time to receive the first payment after lead intake for law firms in the personal injury practice area was 184 days in 2023. (2024 Benchmark Report: Part 2)
Lawyer stress statistics
Being a lawyer is one of the most rewarding professions. However, nonstop work and challenging cases also make it one of the most difficult. Lawyers typically work long hours due to the complex nature of the role and tight deadlines that they must meet. Below are a few statistics about lawyer stress and its effects.
55% of lawyers reported experiencing anxiety in 2024, according to a Bloomberg Law survey. Other issues included disrupted sleep (56%), lower energy/concentration (44%), worsened mood (37%), and depression (29%). (Bloomberg Law)
43% of respondents in a 2024 Bloomberg Law survey reported delaying treatment for their mental health. 72% of this group said they’re delaying treatment because they don’t have time for it. (Bloomberg Law)
In 2024, 62% of attorneys reported that their workplace offers education on mental health and well-being. The remaining 38% said they either did not have access to this type of training or were unsure whether their employer provided it. (Bloomberg Law)
Attorneys worked an average of 48 hours per week in 2024, but only 36 of those hours were billable. (Bloomberg Law)
On average, attorneys reported feeling burned out 42% of the time in 2024, with mid- and senior-level associates experiencing burnout at a rate of 51%. (Bloomberg Law)
62% of attorneys said they sometimes or often encounter other legal professionals whose well-being, substance abuse, or mental health issues interfered with work responsibilities in 2024. (Bloomberg Law)
57% of lawyers cited a need to reduce stress as a reason they’ve considered leaving their job in 2024. (Bloomberg Law)
Attorneys took an average of 9 days off in 2024, but 73% did some work on at least half of their days off. (Bloomberg Law)
27% of attorneys surveyed by Bloomberg Law in 2024 were not aware of their local lawyer assistance programs (LAPs), which provide counseling and other resources for legal professionals. Of those who knew about LAPs in their jurisdictions, only 10% had ever used the resources they provide. (Bloomberg Law)
Access to justice statistics
Access to justice remains one of the legal profession’s most pressing concerns. Findings from the 8am 2026 Legal Industry Report highlight growing concerns about affordability, while also showing optimism around the role technology and AI may play in helping more people access legal support and services.
53% of lawyers described access to justice as somewhat or very poor in 2026. (2026 Legal Industry Report)
72% of legal professionals identified the high cost of legal services as the top barrier to access to justice. (2026 Legal Industry Report)
79% believe technology has improved access to justice in the last 10 years. (2026 Legal Industry Report)
76% believe AI has potential to help narrow the access-to-justice gap in the future. (2026 Legal Industry Report)
55% said expanded funding for legal aid and public defenders would be the most effective way to address the justice gap. (2026 Legal Industry Report)
Rule of law statistics
Concerns about the rule of law have become a growing topic of discussion across the legal profession. The findings below, all drawn from the 8am 2026 Legal Industry Report, highlight how lawyers view current threats to the legal system and which institutions they believe need the most support moving forward.
62% of lawyers believe the rule of law is under threat in 2026. (2026 Legal Industry Report)
Top perceived threats to the rule of law include corruption/abuse of power (59%), political polarization (51%), and misinformation/disinformation (49%). (2026 Legal Industry Report)
33% of lawyers ranked courts and the judiciary as the areas most in need of strengthening to preserve the rule of law. Other top areas included civic education and public awareness (29%), and legislatures and policy-making (22%). (2026 Legal Industry Report)
Learn more about the legal industry
The legal profession is balancing several major shifts at once, from rapid AI adoption and evolving billing models to growing concerns around burnout, access to justice, and the future of the court system. Law firms that invest in efficiency, financial visibility, and operational consistency will be better positioned to adapt as the industry continues to change.
8am MyCase is a cloud-based law firm practice management solution that allows firms to increase productivity while also improving the client experience. It offers tools for case management, client intake and communication, lead management, financial management, and AI-enhanced automation, all in one place. Learn more about practical AI tools from 8am that help legal professionals simplify operations and save time.
Schedule a free demo today to see how MyCase can help your firm stay organized, improve productivity, and prepare for growth in a changing legal landscape.
About the author

Rob Heidrick is a Senior Content Strategist for 8am, a leading professional business solution. He covers the latest advancements in legal technology, financial wellness for law firms, and key industry trends.